
How I test dash cams
Every dash cam review on this site rests on two tools: a printed test chart on an easel, and DashCheck, software I wrote that reads every clip a camera writes to its card. This page explains what each one measures and how to read the numbers it produces, then covers the bench that stands in for a car battery and the drives every camera makes.
Why a printed chart, and why my own software?
Footage from the road can't settle a comparison on its own. The season, the weather, the time of day and the angle of the sun all change between one drive and the next, so two cameras filmed months apart were never looking at the same thing. A printed chart under the same lamps, at the same distance, takes all of that away. It doesn't have to be a perfect instrument. It has to be the same instrument every time, and that is what makes one camera against another a fair comparison.
DashCheck is the other half. It opens the files a camera wrote without changing them and reports what is actually in them. There is no AI in it: every number it prints comes from arithmetic you could check by hand, and anything it can't measure honestly, like a picture that looks over-processed, gets example crops and measured numbers rather than a rating.
The road still matters, because a dash cam earns its keep at night and in low sun, and a chart can't drive. So the drives are fixed too: the same roads in the same direction, started by the position of the sun rather than the clock.
What is on the test chart?
The chart is 48 by 27 inches (about 122 by 69 centimeters), printed on a rigid aluminum composite panel with a matte finish, and it stands on an easel in my office. Before any dash cam saw it, I photographed the print itself with a Canon R7 in raw and characterized every patch, so when a patch reads dark I know how much of that is the paper and how much is the camera.
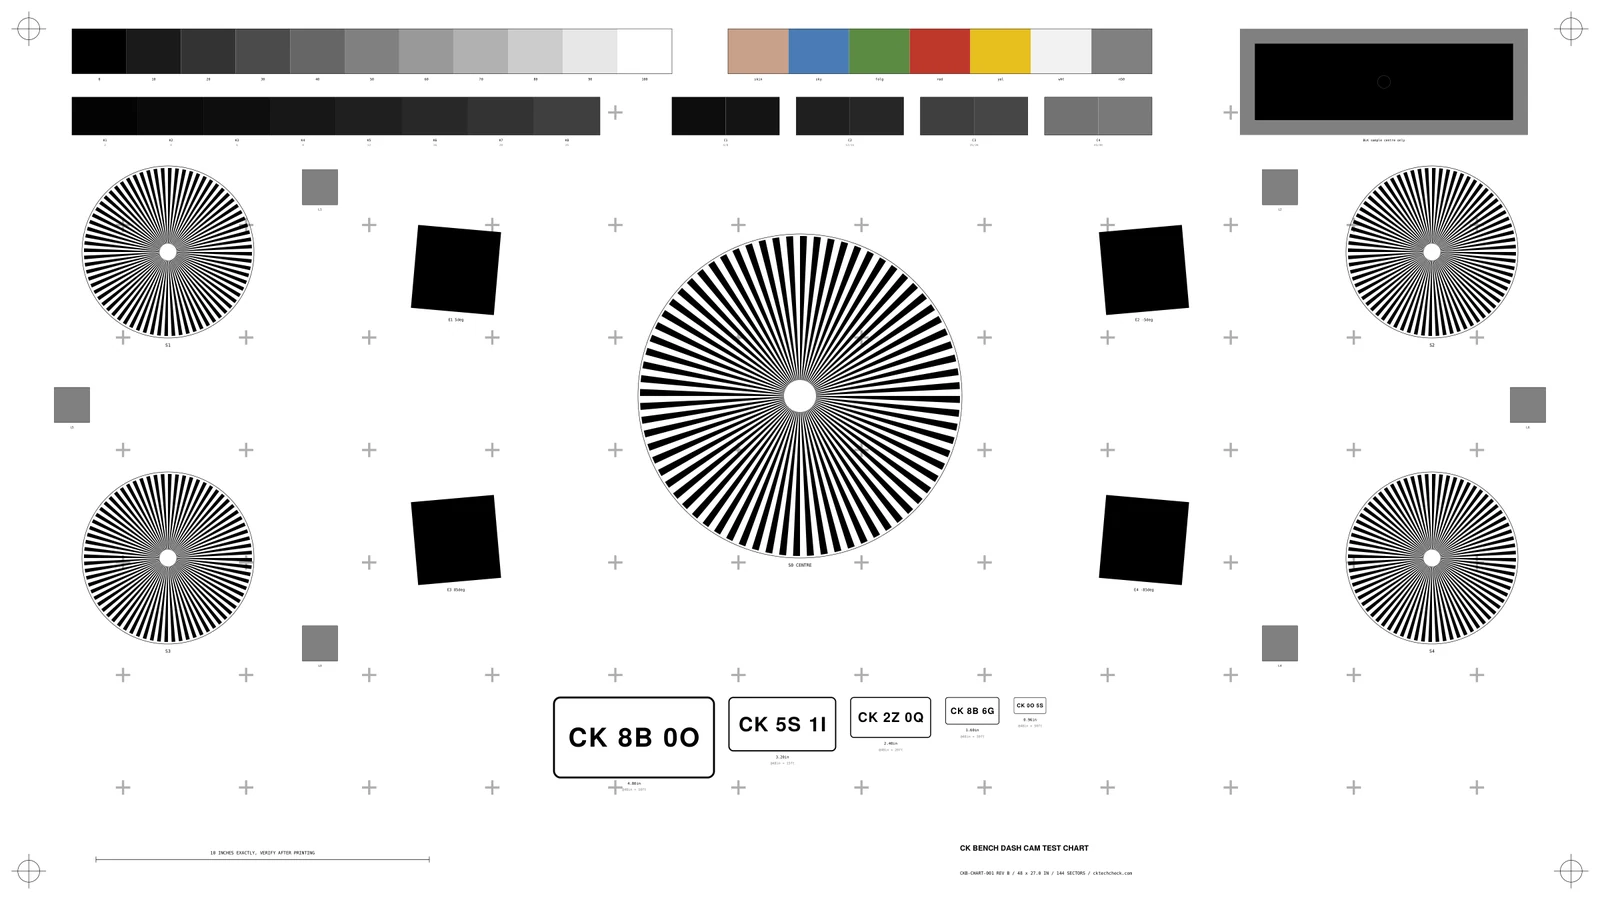
Siemens stars
Five stars, each 72 pairs of black and white spokes meeting at a point, so the detail gets finer toward the center. The big one in the middle is the one I read; the four smaller ones sit further out.
Tilted squares
Four black squares turned about five degrees, two near vertical and two near horizontal. Their edges show how much contrast the camera reproduces at fine detail, which is where sharpening gives itself away.
Grey and shadow ladders
Eleven grey steps from black to white, and eight shadow steps between 2 and 25 percent. They show the tone curve from the crushed shadows up to the clipped highlights, and what HDR changes along it.
Low-contrast pairs and the black patch
Four pairs of greys only 3 percent apart, at different levels, find where a camera stops telling near-identical tones apart. The center of the large black patch, far from anything bright, measures flare.
Six grey patches
Printed identical, to within 2.1 percent by the characterization. If they don't read alike in a camera's frame, the light on the chart is uneven, so they open every session.
Five license plates
Plates that shrink from 4.80 to 0.96 inches wide, set in characters that are easy to confuse. One frame of them is a plate test at five distances, explained below.
Crosses and the scale bar
Faint crosses on a regular grid across the whole panel show distortion. A bar along the bottom marked 10 inches exactly is checked against the print, because every plate distance depends on the print's true scale.
Color patches
Skin, sky, foliage, red, yellow, white and a neutral grey. They are on the chart, but no review quotes a color-accuracy number from them, for the reason given under the limits at the end of this page.
Every session starts the same way. The camera goes on taped floor marks, square to the chart, with the lens eight feet (96 inches) from the chart face. The light at the chart is metered and written down, and a short clip of the six grey patches has to read like the last session on this bench before anything else is shot. A lamp that has moved shows up there first.
How is resolution reported?
The center star is the measuring tool. Its spokes get finer toward the middle, and DashCheck's star reader walks in from the rim to find the radius where the camera stops separating them. The star is a fixed physical size, so that radius becomes a measure of detail. I report it two ways, because they answer different questions.
Percent of the pixel grid
The finest detail a picture can hold is set by its pixel grid: one pixel light, the next one dark. That limit is called Nyquist, and 100 percent of it is the most a camera at that resolution could ever record. The headline reading is where the spokes keep half their contrast (MTF50), as a percentage of the camera's own Nyquist. It describes how well a camera uses the pixels it has, so it never ranks a 2K camera against a 4K one.
Is it real 4K?
The second reading is where faint detail runs out: the point where the spokes keep only a tenth of their contrast (MTF10). Sharpening can exaggerate detail, but it can't invent detail that was never captured, so this is the honest test of a resolution claim. A picture upscaled from 2K to 4K can't carry anything past 67 percent of the 4K grid, because 2560 is two thirds of 3840. A camera whose faint detail runs past that line has a real 4K sensor behind it. One that stops short of it isn't proven fake either, because a soft lens can read the same way, so a review says only what the reading shows.
Detail per degree of view
Percent of the grid can't compare two cameras on its own, because a wide lens spreads its pixels over more of the road. So the comparison figure is cycles per degree: how many pairs of lines the camera separates in each degree of what it sees, at the center of the frame. It folds the resolution and the width of the lens into one number, and it doesn't change with how far away the chart is, so a 2K camera and a 4K camera, or a narrow lens and a wide one, can sit side by side. When a review says one camera holds more detail than another, this is the number behind it.
Sharpening
The tilted squares measure something a lens can't fake. An edge shows how much contrast the camera reproduces at each level of detail, and I read it at half the grid's limit. A lens can only lose contrast, so on its own it can never read above 1.00. A reading above 1.00 is the processor adding contrast the scene doesn't have, which on the road is the bright outline around power lines and signs against the sky. The halo beside each edge is measured too, as a percentage of the edge's own height.
Why the chart sits eight feet away
Dash cams are focused for the road, not for a desk. Put the chart too close and the star measures how far out of focus it is rather than how much the camera resolves. I found that out the hard way, when the same star on the same camera read one and a half times sharper from eight feet than from four. So the eight-foot mark carries every resolution figure, and a nearer mark is only a cross-check: in cycles per pixel the two have to agree, or something is wrong.
How small a plate can it read?
Along the bottom of the chart are five printed license plates, 4.80, 3.20, 2.40, 1.60 and 0.96 inches wide. Every one is set in characters that are easy to mix up: 8 and B, 5 and S, 1 and I, 2 and Z, 0, O and Q, 6 and G. The bar isn't whether you could guess the plate. It's whether you can tell an 8 from a B.
A real plate is 12 inches wide, so each printed plate stands in for a real one at a distance you can work out: twelve times the bench distance, divided by the printed width. From the eight-foot mark the five plates are the size a real plate looks from 20, 30, 40, 60 and 100 feet. One frame is a plate test at five distances with identical light and focus on every rung, which no row of real plates walked out across a parking lot can manage. The result is the smallest plate with every character read, given as the distance a real plate would be at. If every plate reads, the chart is too close to separate anything.
I read the plates by eye, and I know what they say, so each review shows the 100 percent crop for you to judge. Two things make these distances conservative. Real plates set their characters bigger for their size than this chart does, and the chart's plates are printed flat. A real plate is embossed or reflective and gets hit by headlights at night, which is a different test, covered with the road tests below.
What about the corners and the field of view?
The chart covers the middle of the picture. A lens sold as 140 degrees reaches about 70 degrees off center at the corners of the frame, and no chart on an easel gets there, so a review never claims anything about the true corners from the main chart. These fill in around it.
Panning. With the chart left where it is, I turn the camera 45 degrees one way and then the other, so the chart lands toward each side of the frame. Both sides, every time: one side alone can't tell a soft outer field from a lens that is soft on one side. Off center the star bends with the lens's distortion, so out there the tilted squares carry the figure.
Corner panels. Four smaller panels, 18 inches square, each with two tilted squares and a small star, go on the wall at the corners of the frame, at the same distance as the chart. Their edges show whether a corner goes soft and whether the picture is even from one side to the other. They are newer than the chart and not yet part of every session, so a review says when it has them.
Field of view. I put the camera on a tripod and turn it five degrees at a time until the chart runs off the edge of the frame, which measures what it sees side to side and top to bottom. A box figure like 140 degrees is most likely measured corner to corner. When I work out the corner figure from the lens's shape instead of measuring it, the review says so.
Other resolution modes. When a camera offers a lower resolution, the size of the center star in pixels shows what the mode really does. If the star shrinks by the resolution ratio, the camera scaled the whole picture down and you keep the full view. If it stays the same size, the mode is a crop out of the middle and you lose field of view. If only the top and bottom go, it is a letterbox.
Distortion. On a wide lens a straight row of the chart's crosses bows away from the center, the usual barrel shape, and the bow is measured as a percentage of the row's length.
Why does the warm-up matter?
A dash cam heats up as it runs, and heat can move the optics. On one camera on this bench the center of the chart lost 19.5 percent of its fine detail between its first few minutes and 25 minutes in, with the light and the camera's position unchanged, and a restart didn't bring it back. One side of the frame got softer while the other got sharper, which no change in processing can do: the warmth was tilting the focus.
So the warm-up is now a test of its own. The camera starts cold and is left alone at the far mark for 30 minutes, with nobody touching it or the room. The star is read all the way through, and the time since power-up is logged with every chart figure. The figure a review leads with is the warm one, because the warm camera is the one on your drive home.
What happens with the room lights off?
Some of the most useful readings come with the room dark and a single spotlight on the chart. Every comparison is shot as a pair with the camera untouched between the two halves, usually HDR on and then off, then on again to check nothing drifted. Move the camera between the halves and the comparison is worthless.
HDR. A spotlight turns the chart into a genuinely high-contrast scene, so HDR has real work to do. The pair shows what HDR saves at both ends of the scale, and whether it costs any resolution. A second pair tells which kind of HDR the camera runs: I swing a dark card fast past the lens with HDR on and off. Two exposures merged together leave a doubled, hard edge on anything that moves, while a single-exposure HDR leaves one smooth blur. The HDR on or off explainer covers what that means on the road.
Red light. The same star under a red LED instead of white, the camera untouched. On a color sensor only one pixel in four sees red, so a scene lit mostly in red costs resolution before the lower light level even counts. White light can't show this at all, and every dash cam with a color sensor pays some of it.
The headlight plate. Real plates are reflective: they throw headlight energy straight back toward where it came from. To reproduce that, the lamp goes right beside the lens, pointed at real plates mounted next to the chart, which is roughly a car's geometry. DashCheck then measures the plate itself: how much of it is blown to pure white, and whether the characters survive.
Glare and the dark floor. The spotlight pointed into the lens shows how much flare lifts the blacks, and a frame with every light off gives the camera's black level and noise.
Reading the chart numbers
| Figure | What it means |
|---|---|
| Percent of Nyquist (MTF50) | Where the star's spokes keep half their contrast, as a share of the finest detail the camera's pixel grid can hold. How well a camera uses its own pixels. |
| Faint detail (MTF10) | Where the spokes keep a tenth of their contrast. Past 67 percent on a 4K camera, the picture can't be an upscale from 2K. |
| Cycles per degree | Line pairs resolved in each degree of view, at the center of the frame. The figure that compares one camera with another. |
| Edge contrast at half Nyquist | Above 1.00 is the processor adding contrast a lens can't, which you see as halos around edges. |
| Plate distance | How far away a real 12-inch plate would be to look as small as the smallest chart plate the camera reads in full. |
| Warm-up change | How much the center figure moves between a cold start and about half an hour of running. |
What does DashCheck read off the card?
Point DashCheck at a folder of clips and it reads every one. It opens the footage read-only and never writes into the folder it is analyzing, so the files stay exactly as the camera left them. What it finds comes in two kinds. Facts with a right answer, like missing time or a broken file, get a pass, a warning or a fail, with the numbers that earned it. Everything else is a measurement with no score attached, because no honest threshold for it exists yet.
| What it reads | What it answers |
|---|---|
| Gaps between clips | Is any time missing where one clip ends and the next begins? It builds a timeline from every clip's timestamps, and keeps parked time apart from footage that was actually lost. |
| Broken files | Clips that are cut short or won't decode cleanly, found by decoding every file. |
| Dropped and repeated frames | The frame rate actually delivered against the one declared, plus repeated frames: freezes, and the rhythmic duplicates a camera can use to pad out a frame rate it isn't really recording. |
| Frame pacing | How evenly the frames arrived. A camera can deliver every frame it promised on an uneven beat, and the average hides it. |
| Bitrate | Measured in one-second windows. The worst window against the average shows whether the encoder starves when the scene gets busy, and the spread shows whether the camera spends a constant rate or follows the scene. |
| Bits per pixel | The bitrate shared out across every pixel it has to describe, which is how two resolutions compare on compression. |
| Padding | Filler bytes that carry no picture but make a bitrate look bigger. An honest clip reads exactly zero. |
| Blown highlights | The share of pixels driven to pure white (254 or 255 out of 255), in the typical frame and the worst one. Nothing recovers a plate recorded at 255. |
| Crushed black | The same at the other end: pixels at 1 or below. |
| Exposure steps | Sudden jumps in brightness, like a tunnel exit, and how long the camera takes to settle. |
| Detail ladder | Each frame is shrunk to 7/8, 3/4, 5/8 and 1/2 of its size and back, to find the step where real detail is first thrown away. That brackets the size of picture the camera really captured, and it is how a 5 megapixel sensor sold as 4K gets caught on ordinary road footage, no chart needed. Heavy sharpening adds energy the ladder can mistake for detail, so with strong halos the bracket is marked as an upper limit. |
| Halos and compression | Sharpening halos and ringing along edges, and how visible the encoder's block grid is, across the whole picture and in the shadows alone. |
| Storage | Gigabytes per hour from the real bytes and the real running time, and the hours that fit on a 128 or 256 GB card. |
| GPS and G-sensor | Whether that data rides inside the video file or in a separate log beside it. A separate log gets left behind when you copy one clip off the card to send to an insurer. |
| Keyframes | How often the camera stores a complete frame, which caps how much a clip damaged partway through can lose. |
The tonal measures
Blown highlights and crushed black are the frame-wide view: how much of the picture is gone to pure white or pure black, typical and worst. If a camera's footage never reaches full white at all, DashCheck reports its blown highlights as untested rather than zero, because 0 percent blown would otherwise read as good news it didn't earn.
On the chart, the tone curve comes from the grey and shadow ladders, each step read against the bare paper beside it, so HDR's lift at the dark end and its effect at white can be read step by step. Chart white records well under full scale on every dash cam I have put in front of this chart, because the auto-exposure pulls a big bright panel toward middle grey, so tone is compared camera against camera on the same bench, never against an ideal. On the road, the stretch measurements below add the share of the frame near black (16 or under out of 255) and the noise in flat dark areas, which is where night footage turns to mush.
One box instead of the whole frame
A license plate is a few hundred pixels, about 0.01 percent of a 2K frame, so no frame-wide figure can see one destroyed by headlight glare. In a synthetic test, the same blown-out plate read 0.16 percent blown across the frame and 100 percent inside its own box. So DashCheck can measure one rectangle I draw, around a plate on the road or a patch on the chart: how much of it is blown, how dark it is, its contrast, and how much detail survives inside. A bright plate can still be perfectly readable. It's brightness with the detail gone that makes one useless as evidence. DashCheck never looks for the plate itself: I say where to look, and it exports the frame with the box drawn on so the aim can be checked.
Gaps to the millisecond
A camera's own clip timestamps round to whole seconds, so they can't see the dead time between one file closing and the next opening, which is exactly when a crash happens. For that, DashCheck has a timer page: the camera films a screen that prints its own time on every frame to the millisecond, with a checksum, and the joints are read off the picture. A frame it can't read confidently is reported as unreadable rather than turned into a plausible wrong time. On one camera, joints that the file names put at about a second measured 8, 8 and 56 milliseconds.
How is parking mode tested?
Parking mode means wiring the camera into the fuse box, which is why most reviews describe it and almost none measure it. Instead of using my car as the guinea pig, I built a stand-in on the bench: a 12 volt, 7 Ah sealed lead-acid battery, the camera's own three-wire hardwire kit, a battery monitor logging the voltage every ten seconds, and a USB power meter between the kit and the camera.
The trick is one toggle switch on the kit's accessory wire. In a car that wire is only live with the ignition on, and the camera decides whether it is parked from that wire alone. The constant feed and the ground stay connected, so the camera never loses power; flipping the switch only tells it the engine just turned off.
A runtime test goes like this. The battery is charged, then the charger comes off and the battery rests at least four hours, because one straight off the charger reads high; rested and full, it reads 12.7 to 12.9 volts. The camera's parking timer goes to its maximum, so the voltage cutoff ends the run and not the timer, and the bench sits somewhere nothing will wake the G-sensor. The camera records normally for five minutes, then the switch opens, and it runs until the hardwire kit cuts the power. The result is the time from the switch to the cut.
That run also gives the cutoff voltage against the kit's claim, and whether the kit switches the camera back on as the resting battery recovers. The average draw on the 12 volt side is worked out rather than measured: about 60 percent of the battery's 7 Ah is usable between 12.7 and about 11.9 volts, so 4.2 Ah divided by the hours it ran. That 60 percent is an assumption, and a review that quotes the figure says so. The draw at the camera's own input is measured: the USB meter's running total with the camera warm, never a single glance at its display. These runs are where the presets in the parking mode battery calculator come from.
A second test happens in the car, because a camera that is already recording when the engine stops can take a different path from one that boots up parked. With the bench strapped down in the car, I drive, park and flip the switch, then check whether the camera rebooted on its way into parking mode and whether its Wi-Fi and GPS really switch off when the manual says they do. A bump against the car shows whether the G-sensor locks a file.
What the bench can't copy is the rest of a car: an alternator, the voltage dip when the engine cranks, a car baking in the sun, road vibration. And a freshly charged battery is the best case. An older car battery holds less, so read any runtime as a ceiling.
What are the road tests?
Every camera drives the same two routes in the same direction, so cameras can be compared stretch by stretch.
The night route takes about 45 minutes: lit commercial roads with traffic lights, an unlit two-lane road, a freeway stretch at about 60 mph for blur and compression at speed, and a fuel stop under a bright canopy. It starts once the sun is 18 degrees below the horizon, whatever the clock says.
The sunset route is timed so one freeway stretch points almost straight into the setting sun while it sits between 2.5 and 1.5 degrees above the horizon, the hardest light of either drive. The sun only lines up with that road from about mid-October to late February. From there the route carries on through city streets as the light falls, into dusk and then full dark.
The rules keep runs comparable: settings as shipped unless a setting is the test, the glass and every lens wiped first, dry roads as the baseline, and no switching the car off partway unless the test is a restart. Cameras already on the bench ride along on the same drive, so a comparison is the same moment on the same road rather than two different evenings.
Afterwards each stretch is measured from every keyframe: the median brightness, the share of the frame at pure black and near black, the share blown to white and the size of the largest blown patch (a streetlight or a headlamp), and the noise in flat dark areas. Two cameras on the same run compare second for second. Across different nights, traffic, weather and the season move every number, so those comparisons are soft, and the review says so.
Plates at night
A printed plate can't reproduce a real one at night, so that test happens outside. In a dark lot, real plates go on stands at 13, 22 and 33 feet from the lens, lit only by the car's own low beams, with HDR on and then off. The drives add plates at real distances under streetlights, from the cars stopped ahead at lights.
The long card test
Each camera also records long enough to fill its card and start overwriting, then keeps going. DashCheck reads the whole card more than once along the way, looking for lost seconds at every clip change and checking that the camera overwrites its oldest clips while leaving locked ones alone.
Heat and the memory card
A thermal camera goes on the case while the camera records, and a logger on my windshield records how hot the glass gets around the clock, which is what a dash cam sits in on a sunny afternoon. That record is public as the windshield heat log. Where a maker rates a camera for the air around it rather than for its case, the review says which number is which.
Memory cards, including the ones that come in the box, go through CKBench, the same bench as every card review on the site. That is where the SD card picker gets its numbers.
What these tests can't tell you
A method is only worth trusting if it names its gaps. These are the ones that matter most.
One unit. Every number comes from the camera in my hands. If a production run varies from one unit to the next, a single review can't see it.
Motion on the bench. The chart doesn't move, so motion blur on a plate is a road test. And the bench spotlight is a stand-in for headlights, not a copy of their color or their angle.
The windshield. The chart is shot with nothing between the lens and the panel, and on the road there is always a windshield, with its tint and its layers. When a bench result and a road result disagree, that is the first suspect.
Color. The chart has color patches, but the bench has one kind of light and real roads have many, so no review quotes a color-accuracy number.
See the method applied
The chart sections of the COXPAL A17D and VIOFO A119M Pro reviews carry every reading in one table, and the dash cam hub lists every review, newest first, with the tools built from these measurements.
Open the dash cam hub